40 Excel Interview Questions You Should Be Able to Answer as a Data Analyst
Marisa Crous
September 17, 2026
If you’re applying for data-adjacent roles, there’s a good chance an interviewer will hand you a spreadsheet before they ever ask about SQL or Python. Excel is still the first checkpoint most employers use to separate “comfortable with spreadsheets” from “can actually work with data” – and it’s often where career changers lose confidence, even […]
Table of contents
If you’re applying for data-adjacent roles, there’s a good chance an interviewer will hand you a spreadsheet before they ever ask about SQL or Python. Excel is still the first checkpoint most employers use to separate “comfortable with spreadsheets” from “can actually work with data” – and it’s often where career changers lose confidence, even when they’ve used Excel for years.
The good news: most Excel interviews test a predictable set of concepts. Focus on understanding the handful of tools employers actually rely on, and being able to explain your thinking clearly – because ina real analyst role, explaining what you did with the data is as important as doing it.
In this guide, you’ll find a curated set of the questions candidates most commonly face, grouped the way an interview usually builds: general, basic, intermediate, and advanced. We’ve also included a short prep plan, a self-check, and a straight answer to a question a lot of people are too embarrassed to ask out loud: do I actually have the maths skills for this?
“I’m not really a numbers person” – let’s deal with that first
If that thought crossed your mind before you clicked on this article, you’re in good company, and it’s worth addressing before question one. It’s one of the most common things we hear from people looking at a move into data analytics: a worry that everyone else in the room will be better with numbers, or that the coursework will turn out to be maths in disguise.
Here’s a more useful way to think about it: Excel interview questions are fundamentally about structured logic – the maths is secondary. They test whether you can break a messy problem into steps, spot the pattern in a dataset, and explain why you did what you did. If you’ve ever built a formula that failed, figured out why, and fixed it, that’s the actual skill – and it’s the same skill data analytics is built on, just applied with different tools.
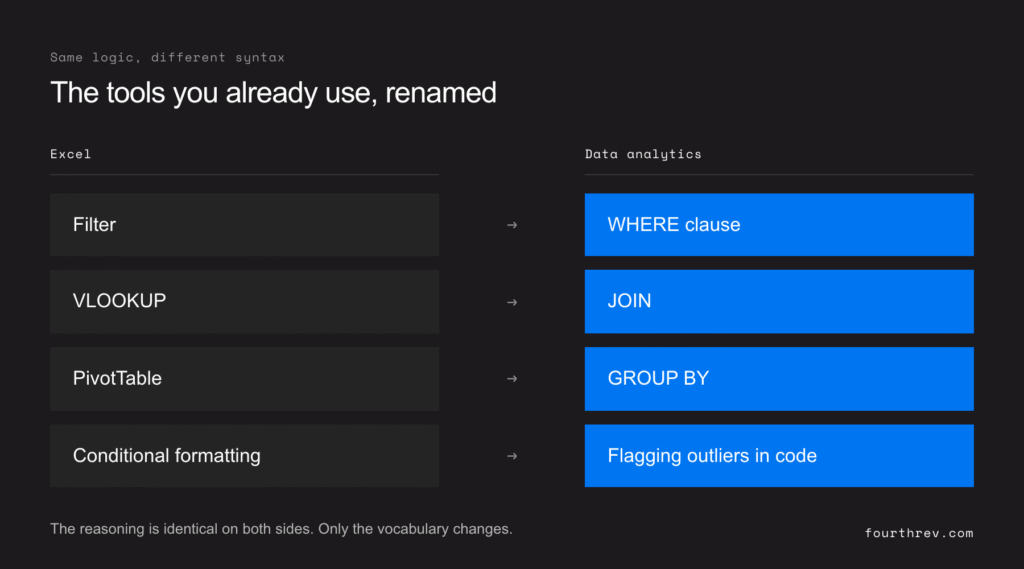
The diagram below shows what we mean. The four Excel tools most people already know map directly onto the tools data analysts use every day. Everything you need is already familiar; only the vocabulary changes.
And if you’re further along in your career and worry the gap is more about outdated tools than confidence, that’s a different, more solvable problem: your instincts are fine; your toolkit just needs a refresh.
General questions
These usually open the interview. They’re less about testing recall and more about understanding how you use Excel day-to-day.
How would you describe your Excel experience? Be specific. “I use Excel daily” tells an interviewer very little. “I build weekly reporting dashboards using PivotTables and conditional formatting, and I’ve automated parts of that process with macros” tells them a lot.
Talk me through a time you used Excel to solve a real problem. Have one or two examples ready, ideally ones where you cleaned messy data, spotted an error, or made something faster or clearer for a stakeholder.
What’s your process for checking your work in a spreadsheet? Employers ask this because a wrong formula that “looks right” is one of the most common ways bad data ends up in a business decision. A good answer mentions spot-checking totals, using formulas like SUMPRODUCT or COUNTIF as sanity checks, and being sceptical of your own numbers.
Basic questions
These confirm the fundamentals are solid before the interview moves on.
What’s the difference between a workbook and a worksheet? A workbook is the whole file; a worksheet is one tab within it.
What’s the difference between relative and absolute cell references? A relative reference (A1) shifts when you copy a formula across cells. An absolute reference ($A$1) stays fixed. This one comes up constantly because getting it wrong is a common source of broken formulas.
How do you freeze rows or columns, and why would you? Freeze panes keep headers visible while scrolling through large datasets – useful for anyone reviewing long lists of records.
What file formats can Excel save to, and why does it matter? .xlsx, .csv, .xlsm (macro-enabled) and .pdf are the common ones. Knowing when to use .csv for data exchange versus .xlsx for formatting-heavy files shows you understand how spreadsheets fit into a wider workflow.
How do you remove duplicate values from a dataset? Data tab → Remove Duplicates, or a formula-based approach using COUNTIF if you want to flag duplicates while keeping the original data in place – worth mentioning, since flagging first is often the safer approach.
Intermediate questions
This is where interviewers start testing whether you can actually work with real, messy data.
What’s the difference between VLOOKUP and INDEX/MATCH? VLOOKUP searches for a value in the first column of a range and returns a value from a column to the right. INDEX/MATCH is more flexible – it can look left, stays more stable when columns are inserted, and is generally considered the more robust choice for larger or evolving datasets.
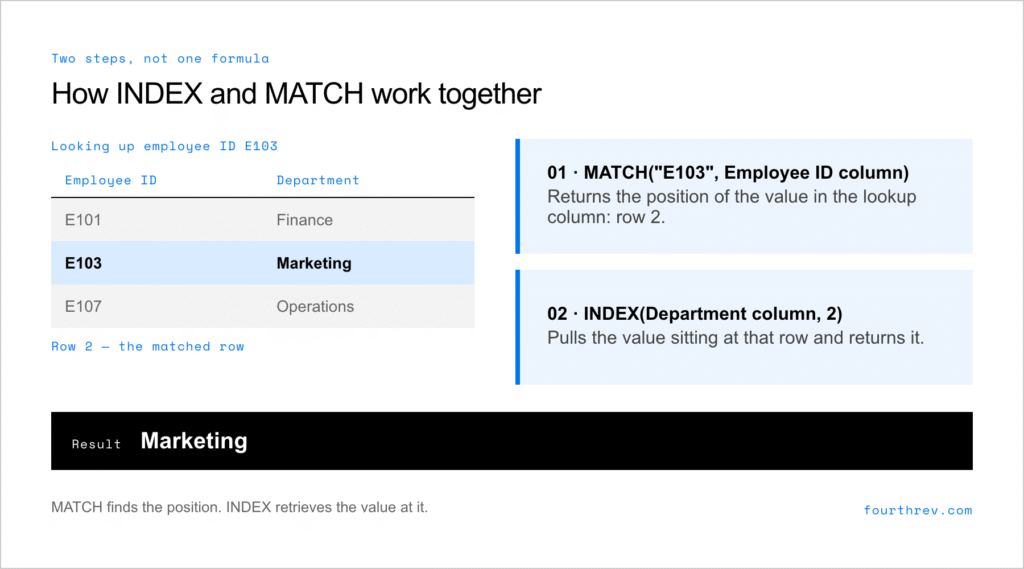
This is also the question where a lot of candidates freeze up, so it’s worth seeing the mechanism laid out rather than just the definition:
MATCH finds the position; INDEX uses that position to retrieve the value. Two simple steps, working together instead of one complicated one.
Try it yourself: take any small table with an ID column and a second column of values. Pick an ID, and manually count down to find its row number. Then look across to that row in the second column. That’s the entire mechanism, run by hand, before a formula ever gets involved.
What are the limitations of VLOOKUP? It can only search left-to-right, it breaks if columns are added or removed, and it’s slower on large datasets than alternatives like INDEX/MATCH or XLOOKUP.
How would you use conditional formatting to highlight outliers in a dataset? Explain the logic first, then the button clicks: you’re setting a rule (e.g. values more than two standard deviations from the mean, or simply above/below a threshold) so exceptions are visible at a glance rather than requiring a manual scan.
How do you build a PivotTable, and when would you use one over a formula-based summary? PivotTables are the fastest way to summarise and re-slice large datasets, skipping the need to write formulas for every combination of categories. The follow-up question is usually “why,” so be ready to explain that PivotTables are better for exploratory analysis, while formulas are often better when the output needs to feed into another system or report.
What’s a macro, and have you built one? A macro records or scripts a repeated task in VBA. Basic familiarity is enough here – you should be able to describe a task you automated and roughly why it saved time.
How do you handle a dataset with missing or inconsistent values? This tests judgement as much as tools. A strong answer covers identifying the gaps (filters, COUNTBLANK), deciding whether to exclude, flag, or impute them, and being transparent with stakeholders about what you did and why.
Advanced questions
These questions separate confident Excel users from people who’ve genuinely used it to solve harder analytical problems.
How would you combine INDEX/MATCH with multiple criteria? This usually means nesting MATCH with an array formula, or using INDEX/MATCH across concatenated helper columns. The interviewer is checking whether you can extend a familiar tool to a less standard problem.
What’s an array formula, and when have you needed one? Array formulas perform multiple calculations across one or more items in an array, returning either a single result or multiple results. A common real-world use is summing values that meet several conditions across scattered ranges.
How would you build a dashboard that updates automatically as new data comes in? A strong answer touches on structuring source data as an Excel Table (so ranges expand automatically), using PivotTables or dynamic formulas linked to that Table, and being deliberate about what a “dashboard” is for – a small number of decisions it helps someone make, rather than every number available.
What’s the difference between XLOOKUP and INDEX/MATCH? XLOOKUP is newer, simpler to write, and can search in either direction natively, but it’s only available in more recent versions of Excel – so knowing both matters if you’re likely to work across organisations with different setups.
How do you audit a spreadsheet someone else built, to check if the formulas are trustworthy? This is a favourite among interviewers because it mirrors real work. Mention tools like Trace Precedents/Dependents, Evaluate Formula, and simply rebuilding a calculation independently to see if you get the same answer.
Where does Excel start to break down, and what would you reach for instead? This is arguably the most important question on this list, and the one most candidates find toughest to answer. A good answer is honest: Excel struggles with very large datasets, version control across teams, and reproducibility. Tools like SQL, Python or Power BI take over from there – and knowing where that line sits is itself a sign of analytical maturity.
A quick self-check
Before you judge yourself against this list, treat it as a reflection exercise rather than a pass/fail test. Tick off what’s actually true for you:
I’ve built a formula that failed, then figured out why and fixed it.
I’ve used a filter or sort to answer a specific question about a dataset.
I’ve spotted an error or inconsistency in a spreadsheet before it caused a problem.
I’ve built or used a PivotTable to summarise something for someone else.
I’ve explained a number or a trend to someone less technical than me.
If two or three of those are true, you already have the reasoning data analytics is looking for. The rest, including the specific syntax of SQL or Python, is learnable – it’s a vocabulary problem more than an aptitude one.
How to actually prepare
A few things matter more than memorising function syntax:
Practise explaining your thinking out loud as well as producing the right answer. Interviewers are assessing whether you could explain a number to a stakeholder outside your technical team, because that’s the job.
Have two or three real examples ready – a time you cleaned messy data, automated something repetitive, or caught an error before it caused a problem. Genuine examples beat rehearsed definitions every time.
Know your limits, and say so honestly. “I’ve only built array formulas occasionally, but here’s how I’d approach it” lands far better than guessing.
Refresh the fundamentals, even if you’re experienced. Absolute vs relative references and VLOOKUP’s limitations come up more often than any advanced topic on this list, and it’s an easy way to lose credibility if you fumble them.
If you’re worried you’ve left it too late, that’s a timing question more than a capability one. Employers care whether your skills are current, more than how many years you’ve been working. Refreshing a toolkit that’s gone stale is a much smaller task than learning to think analytically from scratch – and if you’ve been doing the latter in Excel for years, you’ve already done the hard part.
When Excel questions reveal the real question
If you’re at the point where these questions feel routine – you’ve built the dashboards, cleaned the messy data, automated the repetitive reports – there’s a good chance you’ve already outgrown what Excel alone can offer you. That’s usually the moment we hear from people: not “I need to learn Excel,” but “I’m good at Excel, so why do these roles keep asking for SQL and Python too?”
That gap – between being confident in Excel and being job-ready for a modern analyst role – is what we call the Excel ceiling, and it’s exactly what our Monash Data Analytics Career Accelerator is built to help you move past. Over six months (including a two-week orientation), you’ll build practical fluency across Excel, Power BI, SQL, Python and cloud databases, work on a live Employer Project with a real industry partner, and earn a Monash University Digital Credential, alongside career coaching that continues until you land the role.
The entry criteria are broader than a lot of people assume: you can qualify with prior study or with relevant hands-on experience working with data, reporting or spreadsheets, and no coding background is needed to start. If you’re unsure where you stand, a short data readiness check is a good way to find out, rather than guessing.
Demand for the role is real too: data analyst salaries in Australia range up to AU$110,000 a year according to Glassdoor, and up to AU$143,000 in senior roles, with demand forecast to grow 23.2% over the next five years.
FAQs
Do I need to know Excel perfectly before applying for data analytics roles?
No. Employers expect confidence, not perfection. Understanding the concepts behind VLOOKUP, PivotTables and conditional formatting matters more than having every function memorised.
Is Excel still relevant if I’m learning SQL and Python?
Yes. Most workplaces still use Excel for quick analysis, sharing results with non-technical colleagues, and smaller ad hoc tasks. It doesn’t disappear once you learn other tools – it becomes one of several tools you choose between.
How technical do Excel interviews usually get for entry-level analyst roles?
Most entry-level interviews stay within the basic-to-intermediate range on this list: references, lookups, PivotTables and conditional formatting. Advanced topics like array formulas are more common for mid-level or senior roles.
Do I need to be good at maths to succeed in data analytics?
No, not in the way people usually mean it. Day-to-day analytics work relies on logical thinking, pattern recognition and attention to detail far more than advanced mathematics – most of the actual calculation is done by the software. If you can follow the INDEX/MATCH example above, you already have the kind of reasoning the field is built on.
Thinking about what comes after Excel?Explore the Monash Data Analytics Career Accelerator or read more about the range of careers data analytics skills can open up.