Table of contents

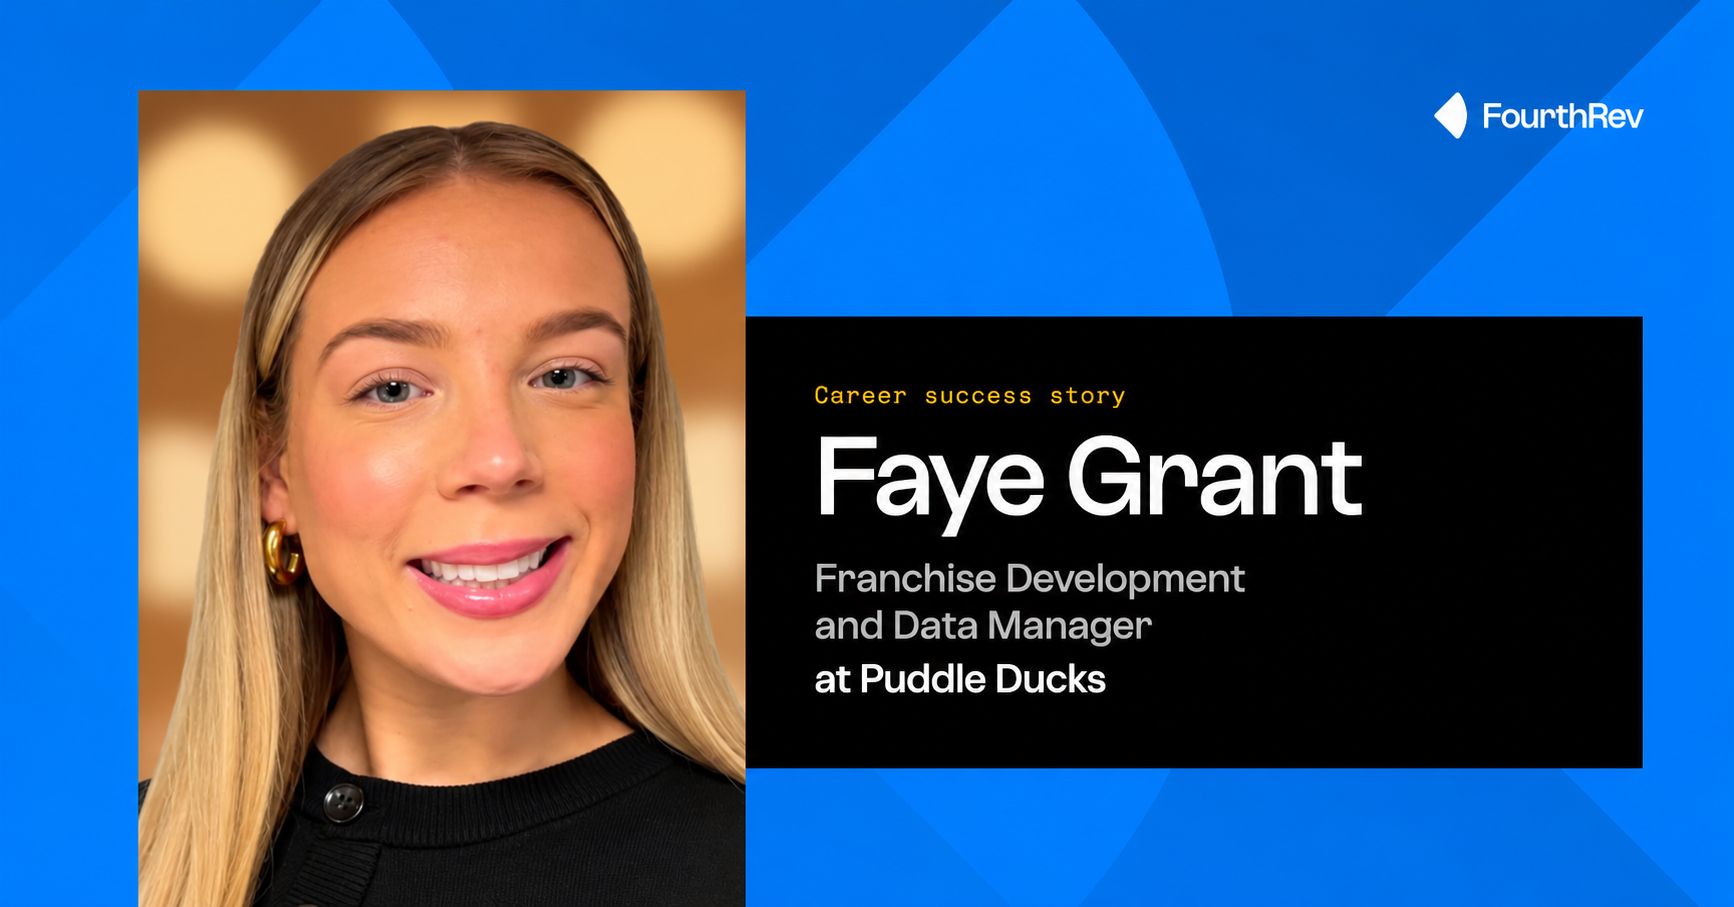
Faye Grant is the Franchise Development and Data Manager at Puddle Ducks, a role she started the month after she finished the LSE Data Analytics Career Accelerator. In an AMA webinar, she shares how she went from forecasting stock in spreadsheets to building her own dashboards, and why she now enjoys her work more than in any role before.
Investigating why, not just reporting the numbers
Faye’s interest in data started in her day job. She studied fashion business and management at university, then worked in merchandising and demand planning roles at several fashion companies. She used sales and stock data to forecast demand and decide how much of each product to buy, mostly in Excel and Power BI.
That was the part of the job she enjoyed most. She “really enjoyed investigating why something was happening, rather than just reporting the numbers”, and wanted to work with data more deeply than her role allowed.
The skills gap she found in data job ads
Faye assumed her transferable skills would be enough to move into a data role, until her research showed “quite a big skills gap”. She looked at data roles on LinkedIn that appealed to her and flagged every unfamiliar term in the job descriptions. The gaps were SQL, Python, R, and the broader analytical techniques behind them.
That was when she decided to make what she calls a “deliberate career transition”. She didn’t want to “become too niche too soon”, so she looked for a programme that would prepare her for roles leaning towards coding as well as visualisation, and chose the LSE Data Analytics Career Accelerator.
Learning to see errors as part of the process
Faye came to see her mistakes as part of the learning. Moving from Excel into programming languages was hard at first, and she’s honest that self-doubt came with it. She used to struggle when things didn’t work straight away. Over time, she saw that every fix taught her how to solve the same problem next time, and that “when things are going wrong, it can be a bit of a blessing”.
She didn’t work through it alone. Live calls and posts on the learning platform showed her that other learners faced the same problems, and people with different strengths helped each other. Her Success Manager was always someone to “bounce some ideas off”. Support is built into every Career Accelerator, and for Faye that meant peers and a Success Manager to work through problems with. Her takeaway: “finding something difficult doesn’t mean you’re incapable of learning it.”
As a practical learner, she found the weekly tasks the most useful part of the curriculum, because “repetition is such a good way of learning those skills”. That is the idea behind project-based learning.
A daily target, around 15 to 20 hours a week
Faye kept to a daily target. She studied while travelling, so she set a fixed number of hours and a goal for each day, and stuck closely to the suggested time for each module. Most of the learners she spoke to worked full-time and studied in the evenings and at weekends. She puts the average at around 15 to 20 hours a week, with more before a submission and a lighter week after it.
A team of six and data the business planned to use
The programme finishes with a live brief from a real company, and Faye’s team delivered work the company asked to use. For the Employer Project, she worked in a team of six. They divided the work by strength (coding for some, visualisation for others) and presented their findings to the employer at the end.
She says, “…it did really feel like we were doing a project for the employer, which I guess we were”. Working together online also prepared her for her current job, much of which happens online too.
Reframing a merchandising CV for data roles
Faye found her 1:1 sessions with her Career Coach a big help in the move into data.
“She helped me with what sites to look on for data jobs, key buzzwords that you perhaps wouldn’t think of, and also reframing the past experience that I do have, and how transferable that is.”
Her coach also helped her tailor her CV to specific roles and prepare for interviews. With so many polished CVs in circulation, Faye found that a portfolio of projects, including her Employer Project, gave employers something more concrete to look at.
Asking better questions, a few months into the job
One of the most useful skills Faye brings to work is knowing what to ask before starting a piece of work. A few months into her role, she uses SQL, Python, Tableau and Excel. On the programme, each brief set out who the work was for and what they expected. At work, that isn’t always the case, so “it’s knowing those questions to ask to get all the information that you need.”
She’s also building her own dashboards in Power BI, which came easily after Tableau.
The cheat sheet she’d start on day one
Faye would do the programme again, and this time she’d start a cheat sheet on day one, noting quick fixes and standard steps for each tool as she went. She feels the investment has been worth it, pointing to her salary, the LSE connection and the portfolio she can show employers.
She’s been researching AI on her own and plans to keep learning, because “things do move really quickly”. Longer term, she’d like to take on short-term data projects for smaller businesses. For anyone unsure about committing, she points out that “6 months is such a short amount of time to dedicate towards yourself and potential career growth”.
If you want to move from reporting numbers to explaining them, explore the LSE Data Analytics Career Accelerator. It runs online, part-time, for six months, with 12 months of 1:1 career coaching and an LSE certificate.
This LSE programme is designed and delivered in collaboration with FourthRev.
Share:


